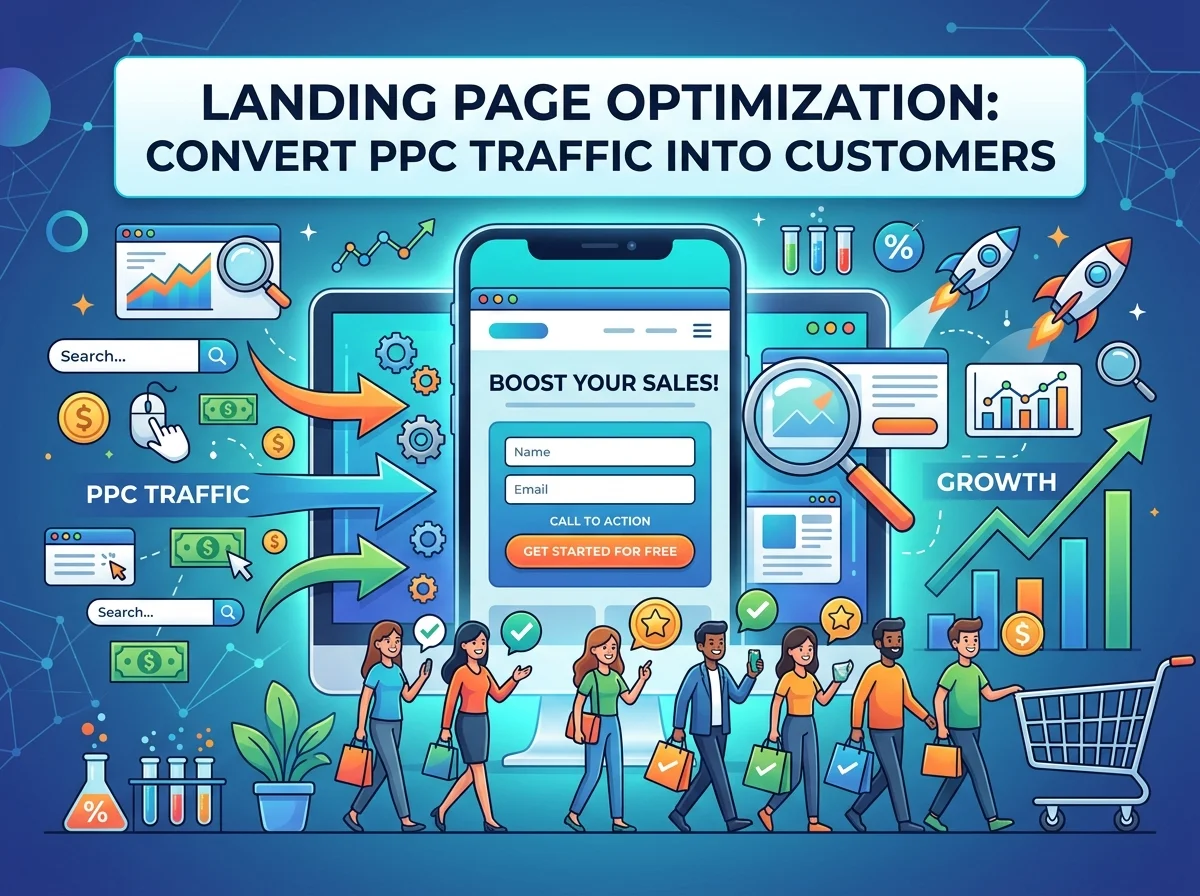
You’re running PPC ads. Getting clicks. But clicks aren’t converting. People land on your page. They leave. Nothing happens. You’re wasting money on traffic that doesn’t convert.
Here’s the problem: most people focus on ads. They ignore landing pages. Ads drive traffic. Landing pages convert traffic. If your landing page is weak, ads are pointless. You’re paying for traffic you’re not converting. That’s expensive.
Landing page conversion optimization fixes this. It turns traffic into customers. This guide covers everything. How conversion rate optimization works. Why A/B testing matters. How form optimization increases submissions. Why page speed optimization is critical. How user experience affects results. Real strategies. Proven tactics. By the end, you’ll know how to optimize pages that convert.
Landing page optimization is critical, but it’s just one piece of successful PPC advertising. Understanding how ad platforms, targeting, and conversion optimization work together creates profitable campaigns. Start with our complete PPC advertising and conversion strategy guide.
Why Landing Page Conversion Optimization Matters
Most businesses ignore landing pages. They focus on ads. Wrong priority. Landing pages determine if ads work.
Think about it. You spend $1,000 on ads. Get 100 clicks. Your landing page converts 1%. One customer. Cost per customer: $1,000. Bad.
Same $1,000. Same 100 clicks. Optimized landing page converts 5%. Five customers. Cost per customer: $200. Excellent.
The ads are identical. The traffic is identical. The only difference is the landing page. That’s the power of landing page conversion optimization. Better page. Better results. No more ad spend needed.
Improvement compounds. Better page means lower customer acquisition cost. Lower cost means more budget available. More budget means more ads. More ads mean more customers. Growth accelerates.
Better landing pages mean lower cost-per-customer from Google Ads. But ad management matters too. Poor keyword selection or bad ad copy wastes money before visitors even reach your landing page. Learn Google Ads campaign management and optimization to improve the entire funnel
Understanding Conversion Rate Optimization: The Basics
Conversion rate optimization is improving the percentage of visitors who convert.
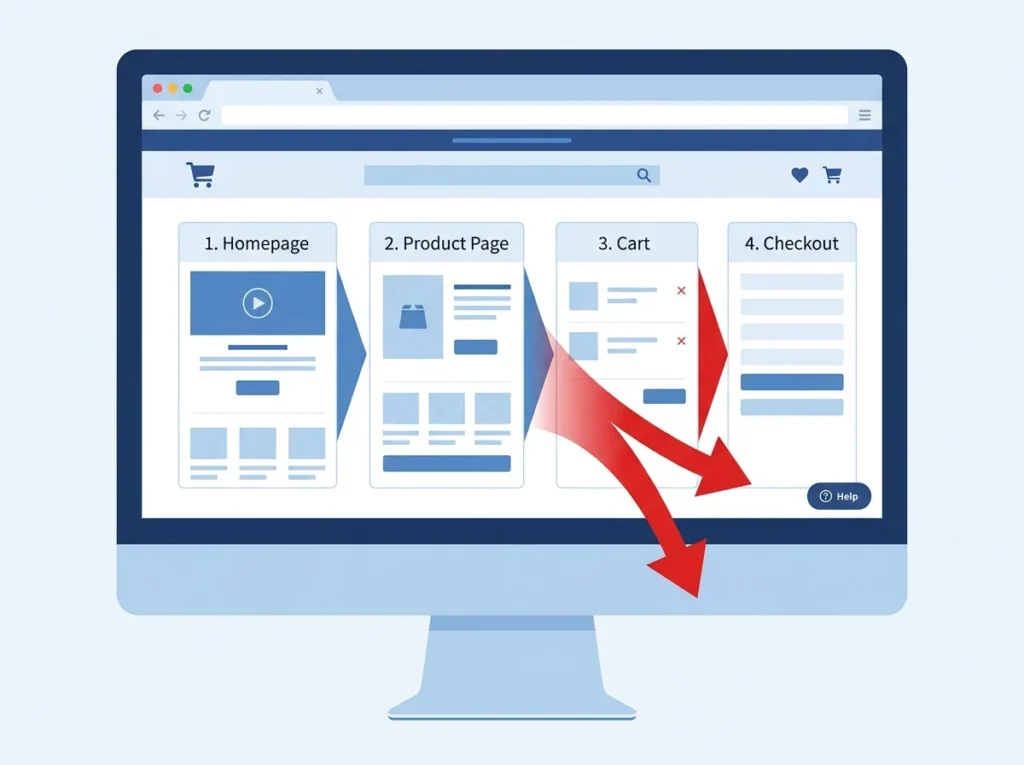
What’s a Conversion?
Conversion is completing desired action. Form submission. Phone call. Purchase. Email signup. Download. Different for different businesses.
For service businesses, conversion is often a form submission or phone call. For e-commerce, it’s a purchase. For SaaS, it’s a trial signup.
Identify what conversion means for your business. Track it. Measure it. Improve it.
Current Conversion Rate
Calculate your current rate. Total conversions divided by total visitors. Multiply by 100. That’s your percentage.
100 visitors. 2 conversions. 2% conversion rate.
Even small improvements compound. 2% to 3% is 50% improvement. Same traffic. 50% more customers. That’s powerful.
Benchmarks
Industry benchmarks vary. Service businesses average 2-5%. E-commerce averages 1-3%. Excellent is 5-10%. Outstanding is 10%+.
Know your starting point. Track improvement over time. Focus on consistent improvement. Not perfection immediately.
Conversion rates vary by traffic source. Cold traffic from Facebook converts differently than hot search traffic from Google. Understanding these differences helps you set realistic expectations and optimize accordingly. Explore Facebook Instagram ads conversion strategies for social traffic.
A/B Testing: Testing What Works
A/B testing is essential. You can’t improve what you don’t test.
How A/B Testing Works
Create two versions of your page. Change one element. Headline. Button color. Image. Form fields. Everything else stays the same.
Send half traffic to version A. Half to version B. Measure which converts better. Winner becomes your new control. Test something else.
Continuous testing. Small improvements. Compound over time.
What to Test First
Test headlines. Strongest impact on conversion. Test CTAs (call-to-action buttons). Test form fields. Test images. Test copy. Everything can be tested.
Prioritize by impact. Headlines impact everything. Test those first. Then CTAs. Then images. Work down the list.
Statistical Significance
Don’t make decisions on small samples. Need minimum 100 conversions per variation. Ideally 200-300. Small sample sizes mislead. Wait for data.
Test for minimum 2 weeks. Longer is better. Different times perform differently. Full week data eliminates day-of-week bias.
Common Mistakes
Testing too many things at once. Change multiple elements. Don’t know what caused improvement. Test one thing at a time.
Ending tests too early. Small sample. Premature conclusion. Wait for data. Patience is critical.
Form Optimization: Getting More Submissions
Forms are critical for conversions. Complicated forms kill conversions.

Reduce Form Fields
Every field reduces completion rate. Ask only essential questions. Name. Email. Phone. Maybe one more. Not ten fields.
Extra fields feel intrusive. People abandon forms rather than share data. Keep forms short.
Smart Field Ordering
Ask easy questions first. Name. Email. Phone. Then harder questions. Budget. Timeline. Company size. Easy flow feels natural.
Psychological principle: commitment. Early questions build commitment. By time you ask hard questions, they’re invested.
Clear Labels
Field labels must be clear. “Full Name” not “Name.” “Email Address” not “Email.” Clear labels reduce errors. Increase completion.
Placeholder text inside fields confuses people. Use labels above fields. Clearer. Better UX.
Mobile-Optimized Forms
Most submissions on mobile. Forms must work on mobile. Single column layout. Large buttons. Easy to tap. Test on actual phones.
Mobile form abandonment is high. Mobile optimization matters enormously. Prioritize mobile.
Progressive Profiling
Ask basic info first. Follow up with advanced info later. Email form asks name and email. Follow-up asks budget and timeline. Staged approach. Higher completion rates.
Reassurance Elements
Trust badges increase submissions. Security logos. Privacy statements. Money-back guarantees. Social proof. Reviews. These reduce friction. Increase submissions.
Page Speed Optimization: Why It Matters
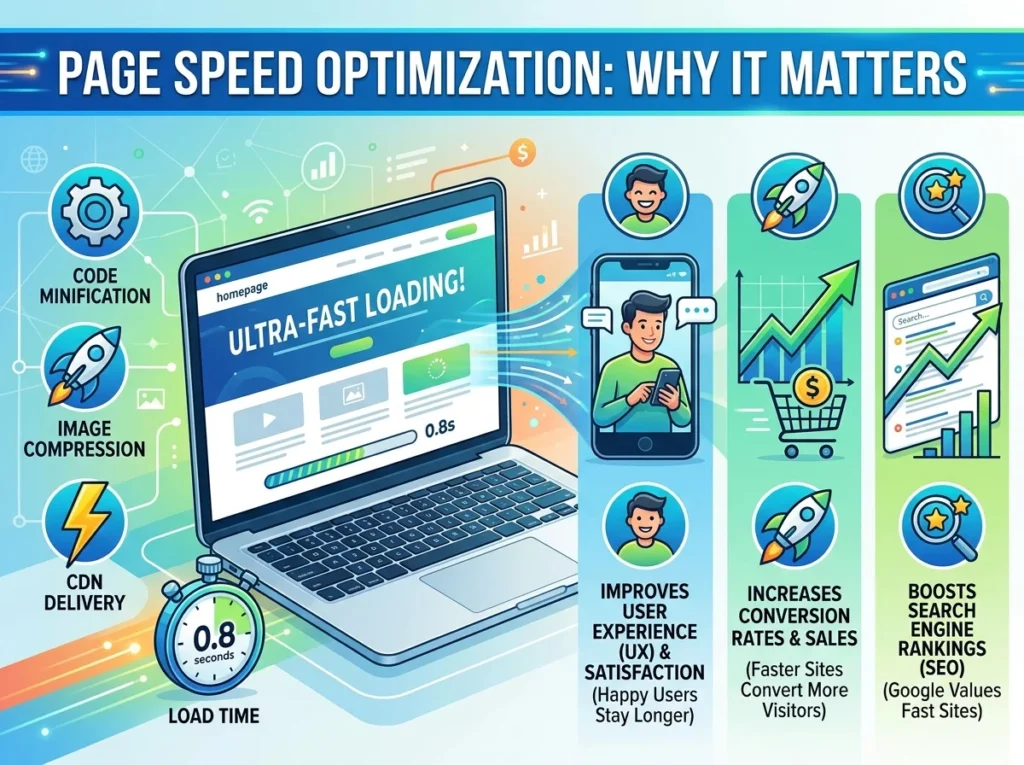
Page speed affects conversions. Every second matters.
Why Speed Matters
Slow pages frustrate users. People bounce. Leave immediately. Never see your offer. Conversion impossible.
Google studies show: 1-second delay = 7% conversion drop. 2-second delay = 14% drop. 3-second delay = 40% drop. Speed is critical.
Testing Your Speed
Use Google PageSpeed Insights. Free tool. Tests desktop and mobile. Gives score. 0-100. Higher is better. 90+ is excellent. 70-89 is good. Below 70 needs work.
Test on actual connections. Not just fast WiFi. Real user connections. Real mobile networks. That’s what matters.
Common Speed Issues
Large images slow pages. Compress images. Optimize formats. JPG. WebP. Reduce size.
Too many scripts slow pages. Remove unnecessary tracking. Analytics only. Third-party widgets. Disable unused features.
Unoptimized hosting slows everything. Shared hosting is slow. Dedicated servers faster. CDN (content delivery network) speeds delivery.
Optimization Steps
Compress images. Remove unnecessary plugins. Enable caching. Use CDN. Minimize code. Remove unused CSS. Lazy load images below fold. Test again.
Target under 3 seconds load time. Mobile target under 4 seconds. Faster is always better.
User Experience: Making Pages That Convert
User experience determines if visitors convert or leave.
Clear Value Proposition
Headline must immediately communicate benefit. “Modern Countertops. Quality Installation. Lifetime Warranty.” Not “Welcome to Our Site.”
Benefit not features. People don’t care about features. They care about results. Your benefit. Their problem solved.
Simple Navigation
Remove navigation from landing pages. No menu. No links to other pages. No distractions. Single path to conversion. Visitor focused on offer.
Standard landing pages remove all navigation. Everything points to conversion.
Visual Hierarchy
Most important information first. Headline. Benefit. Social proof. Then supporting details. Call-to-action prominent. Easy to see. Easy to click.
Use whitespace. Don’t cram everything. Breathing room. Cleaner look. Better focus.
Trust Signals
People don’t trust strangers. Build trust. Social proof. “Over 1,000 happy customers.” Reviews. Testimonials. Case studies. Before-and-after images.
Trust badges. Certified. Insured. Licensed. Warranties. These reduce friction. Increase confidence. Increase conversions.
Clear Call-to-Action
CTA button should be obvious. Contrasting color. Clear copy. “Get Free Quote.” “Call Now.” “Schedule Consultation.” Direct. Action-oriented.
CTA above fold. Visible without scrolling. Below fold CTA too for completeness. Multiple CTAs okay if consistent.
Mobile Responsiveness
50%+ traffic is mobile. Page must work perfectly on mobile. Touch-friendly. Large buttons. Easy to tap. Readable. No pinching. No zooming.
Mobile users behave differently than desktop. Quick decisions. Less reading. More action-focused. Design accordingly.
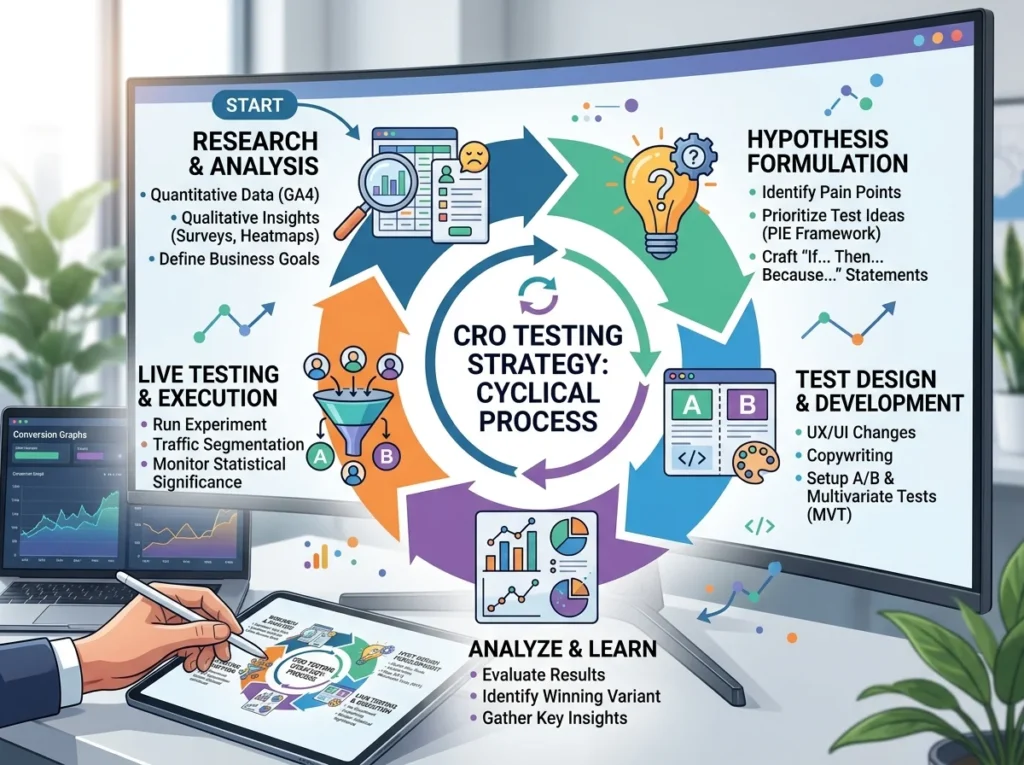
Conversion Rate Optimization Testing Strategy
Systematic approach to improvement.
Month 1: Baseline and Headlines
Document current conversion rate. This is baseline. Test headlines. Most impact. Test 2-3 variations. Run for 2+ weeks. Measure winner.
Month 2: Buttons and CTAs
Test button color. Button copy. Placement. Test 2-3 variations. Run 2+ weeks. Measure winner.
Month 3: Form Optimization
Reduce fields. Test field order. Test reassurance elements. Measure improvements.
Month 4: Page Speed
Analyze speed. Optimize images. Remove scripts. Test speed improvements. Measure conversion impact.
Month 5: Social Proof
Add testimonials. Before-and-after images. Case studies. Trust badges. Measure improvements.
Ongoing
Continue testing. Small improvements. Compound over time. Never stop optimizing.
Optimized landing pages require technical expertise, design skills, and conversion knowledge. Building high-converting pages from scratch saves months of testing. Our professional landing page design and development creates pages that convert from day one.
Real Results of Landing Page Conversion Optimization
What’s realistic improvement?
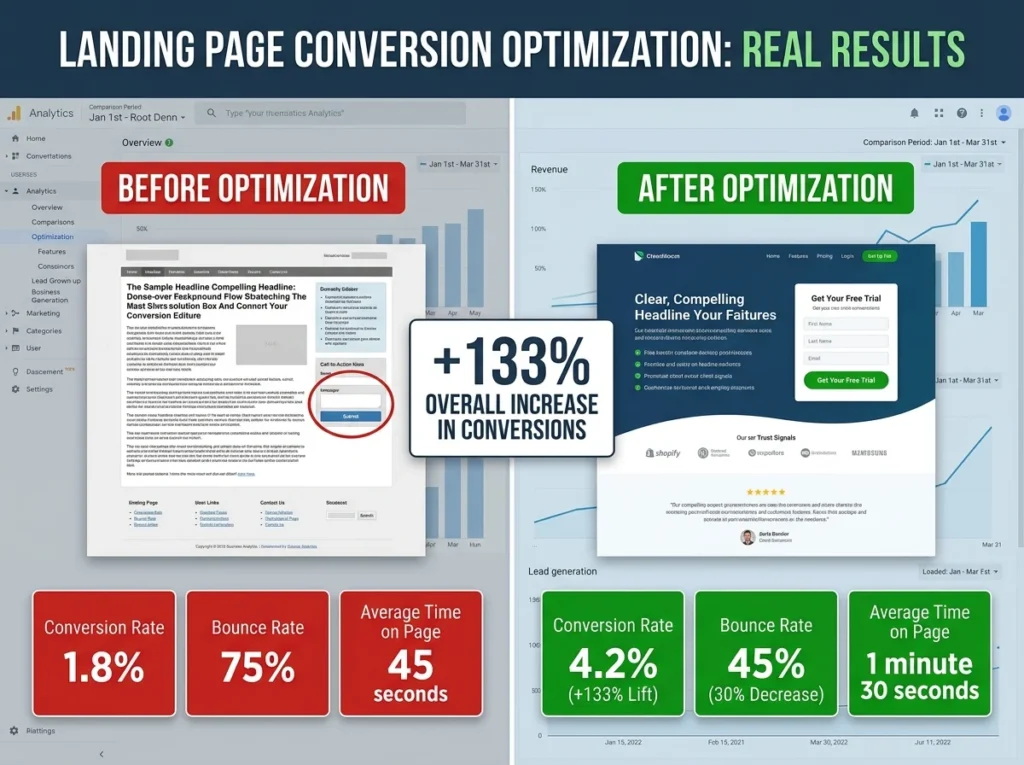
Conservative Improvement
Start at 2% conversion. Optimize carefully. Reach 3%. 50% improvement. Same traffic. 50% more customers.
Aggressive Optimization
Start at 2%. Optimize aggressively. Reach 5%. 150% improvement. Three times more customers. Same ad spend.
Exceptional Performance
Start at 2%. Reach 8%+. Four times more customers. Requires consistent testing. Months of work. Possible with dedication.
FAQ About Landing Page Conversion Optimization
How long before I see conversion improvements?
Changes take 2-4 weeks to show impact. Need time to gather data. 4-6 weeks to understand patterns. Full optimization takes 3-6 months of testing. Be patient. Consistency matters.
What’s a good conversion rate?
2-5% is typical. 5-10% is excellent. 10%+ is outstanding. Industry varies. Service businesses higher. E-commerce lower. Benchmark against your industry. Focus on consistent improvement.
Should I hire an expert or DIY?
You can manage if willing to learn. Learning curve is 2-3 months. Tools are free (Google Optimize). Or hire expert. Consultant costs $500-$2,000 monthly. If they improve conversion 1%, they pay for themselves. Many use hybrid: hire for strategy. You implement.
What’s the most important element to optimize first?
Headlines have biggest impact. Test headlines first. Then CTAs. Then images. Then form fields. Headlines drive everything. Optimize those first.
How many variations should I test?
Test one element at a time. Two variations (A and B). Winner becomes control. Test something else. Never test multiple elements simultaneously. Can’t identify what worked.
Can a good landing page fix bad ads?
Partially. Great landing page improves conversion significantly. But bad ads still send wrong traffic. Fix ads and landing page. Both matter. Quality traffic plus quality page equals optimal results.